PEPE Price Prediction: Analyzing the Path to $0.00001800

#PEPE
- Technical indicators show PEPE trading below its 20-day MA but with positive MACD momentum
- Market sentiment is mixed with bullish targets of $0.00001800 but advised caution
- Breaking above $0.00001099 resistance is crucial for confirming upward trajectory
PEPE Price Prediction
Technical Analysis: PEPE Shows Mixed Signals Near Key Support
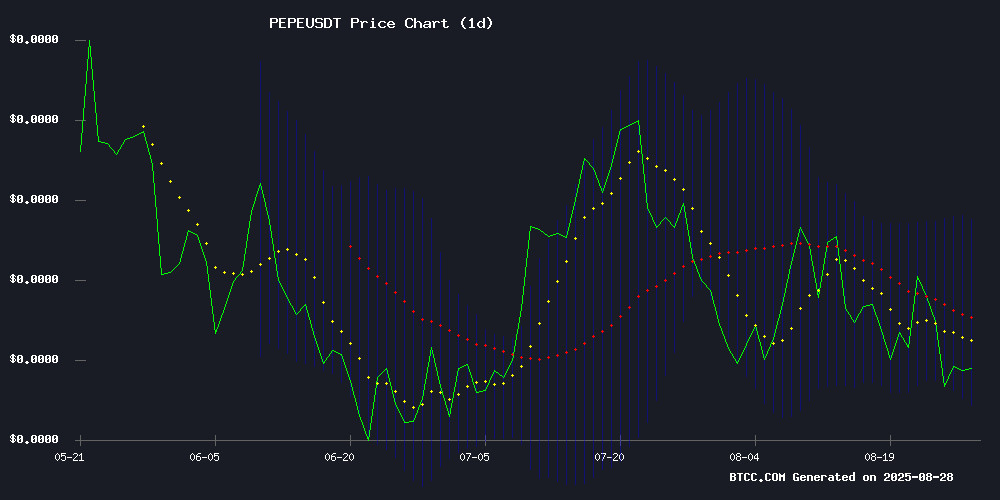
According to BTCC financial analyst John, PEPE's current price of $0.00001006 sits below its 20-day moving average of $0.00001099, indicating potential short-term weakness. The MACD reading of 0.00000067 above the signal line suggests some bullish momentum remains, while trading near the lower Bollinger Band at $0.00000944 could indicate an oversold condition. John notes that a break above the middle band at $0.00001099 WOULD be crucial for confirming upward momentum.
Market Sentiment: Cautious Optimism Amid Bullish Targets
BTCC financial analyst John observes that recent news highlights mixed sentiment around PEPE. While some articles promote it as a leading memecoin for the bull run and project gains toward $0.00001800, others advise caution due to conflicting signals. John emphasizes that the 2% gain in 24 hours shows resilience but recommends watching for a confirmed breakout above technical resistance levels before expecting sustained upward movement.
Factors Influencing PEPE's Price
Top Crypto to Buy Now: Why Pepeto Leads the Best Memecoins for the Bull Run
Meme coins are reclaiming the spotlight as the crypto market heats up, but not all are built to last. Among the frog-themed tokens vying for attention—Pepe, Little Pepe, and Pepeto—only one combines the essential trifecta of community, utility, and fundamentals to thrive in the 2025 bull run.
Pepe, the 2023 breakout star, now faces diminishing returns. Its bloated market cap rules out exponential gains, and the absence of ecosystem development or strategic vision leaves it reliant on nostalgia. Recognition without innovation is a precarious foundation.
Little Pepe rode presale hype to early momentum but struggles to transition beyond speculative appeal. The project’s roadmap lacks substance, raising questions about its ability to sustain interest post-launch.
PEPE Gains 2% in 24 Hours, Eyes Breakout Toward $0.00001800 Target
PEPE has shown early signs of recovery, gaining 2.04% in the last 24 hours despite a weekly loss of 2.13%. The token's mixed short-term sentiment reflects shifting market dynamics, with strong support at $0.00000900 underpinning bullish reversal potential.
Trading at $0.00001013 with a market capitalization of $4.26 billion, PEPE's 24-hour volume dipped 41.55% to $591.63 million, signaling reduced activity. The technical structure suggests a W-shaped reversal pattern may be forming, with resistance at $0.00001800 serving as the next target for bulls.
Investor confidence appears to be slowly rebuilding, as repeated tests of the support level demonstrate resilience. The lower boundary of PEPE's consolidation range continues to hold, reinforcing the potential for upward momentum.
PEPE Price Prediction: Mixed Signals Suggest Caution Amid Bullish Targets
PEPE's price trajectory presents a paradox for traders. Technical analysis reveals a potential 40-80% upside to $0.0000189-$0.0000253 by September 2025, with Joe Swanson identifying a double-bottom pattern targeting $0.00001890. Yet bearish momentum indicators and CoinCodex's conservative $0.000007935 forecast for August 2025 create headwinds.
The meme coin's volatility mirrors broader sector trends, where speculative assets oscillate between breakout potential and corrective pullbacks. Key resistance at $0.00001265 remains the litmus test—a decisive break could validate the bullish scenario, while failure may confirm the 25% downside risk to $0.000007935.
How High Will PEPE Price Go?
Based on current technical indicators and market sentiment, BTCC financial analyst John suggests that PEPE could potentially reach the $0.00001800 target mentioned in recent analysis, representing approximately an 80% increase from current levels. However, this would require breaking through several resistance levels and maintaining bullish momentum. The following table summarizes key price levels:
| Support/Resistance | Price Level (USDT) | Significance |
|---|---|---|
| Current Price | 0.00001006 | Testing lower Bollinger Band |
| Immediate Resistance | 0.00001099 | 20-day Moving Average |
| Strong Resistance | 0.00001253 | Upper Bollinger Band |
| Target Price | 0.00001800 | Bull run projection |
